HISTORY SERIES
Richard D. Wyckoff
1873–1934

This page provides an overview of Wyckoff's theoretical approaches to the markets along with graphics showing the Wyckoff price cycle.
Richard Demille Wyckoff was an early 20th-century pioneer in the technical approach to studying the stock market. He is considered one of the five “titans” of technical analysis, along with Dow, Gann, Elliott and Merrill. At age 15, he took a job as a stock runner for a New York brokerage. Afterwards, while still in his 20s, he became the head of his own firm. He also founded and, for nearly two decades wrote, and edited The Magazine of Wall Street, which, at one point, had more than 200,000 subscribers. Wyckoff was an avid student of the markets, as well as an active tape reader and trader. He observed the market activities and campaigns of the legendary stock operators of his time, including JP Morgan and Jesse Livermore. From his observations and interviews with those big-time traders, Wyckoff codified the best practices of Livermore and others into laws, principles and techniques of trading methodology, money management and mental discipline.
From his position, Mr. Wyckoff observed numerous retail investors being repeatedly fleeced. Consequently, he dedicated himself to instructing the public about “the real rules of the game” as played by the large interests, or “smart money.” In the 1930s, he founded a school which would later become the Stock Market Institute. The school's central offering was a course that integrated the concepts that Wyckoff had learned about how to identify large operators' accumulation and distribution of stock with how to take positions in harmony with these big players. His time-tested insights are as valid today as they were when first articulated.
HISTORY SERIES
Richard D. Wyckoff
1873–1934

This page provides an overview of Wyckoff's theoretical approaches to the markets along with graphics showing the Wyckoff price cycle.
Richard Demille Wyckoff was an early 20th-century pioneer in the technical approach to studying the stock market. He is considered one of the five “titans” of technical analysis, along with Dow, Gann, Elliott and Merrill. At age 15, he took a job as a stock runner for a New York brokerage. Afterwards, while still in his 20s, he became the head of his own firm. He also founded and, for nearly two decades wrote, and edited The Magazine of Wall Street, which, at one point, had more than 200,000 subscribers. Wyckoff was an avid student of the markets, as well as an active tape reader and trader. He observed the market activities and campaigns of the legendary stock operators of his time, including JP Morgan and Jesse Livermore. From his observations and interviews with those big-time traders, Wyckoff codified the best practices of Livermore and others into laws, principles and techniques of trading methodology, money management and mental discipline.
From his position, Mr. Wyckoff observed numerous retail investors being repeatedly fleeced. Consequently, he dedicated himself to instructing the public about “the real rules of the game” as played by the large interests, or “smart money.” In the 1930s, he founded a school which would later become the Stock Market Institute. The school's central offering was a course that integrated the concepts that Wyckoff had learned about how to identify large operators' accumulation and distribution of stock with how to take positions in harmony with these big players. His time-tested insights are as valid today as they were when first articulated.
Who Is The "Composite Man"
“…all the fluctuations in the market and in all the various stocks should be studied as if they were the result of one man’s operations. Let us call him the Composite Man, who, in theory, sits behind the scenes and manipulates the stocks to your disadvantage if you do not understand the game as he plays it; and to your great profit if you do understand it.”
(The Richard D. Wyckoff Course in Stock Market Science and Technique, section 9, p. 1-2)
Based on his years of observations of the market activities of large operators, Wyckoff taught that:
The Composite Man carefully plans, executes and concludes his campaigns.
The Composite Man attracts the public to buy a stock in which he has already accumulated a sizeable line of shares by making many transactions involving a large number of shares, in effect advertising his stock by creating the appearance of a “broad market.”
One must study individual stock charts with the purpose of judging the behavior of the stock and the motives of those large operators who dominate it.
With study and practice, one can acquire the ability to interpret the motives behind the action that a chart portrays. Wyckoff and his associates believed that if one could understand the market behavior of the Composite Man, one could identify many trading and investment opportunities early enough to profit from them.
Wyckoff Price Cycle
According to Wyckoff, the market can be understood and anticipated through detailed analysis of supply and demand, which can be ascertained from studying price action, volume and time. As a broker, he was in a position to observe the activities of highly successful individuals and groups who dominated specific issues; consequently, he was able to decipher, via the use of what he called vertical (bar) and figure (Point and Figure) charts, the future intentions of those large interests.
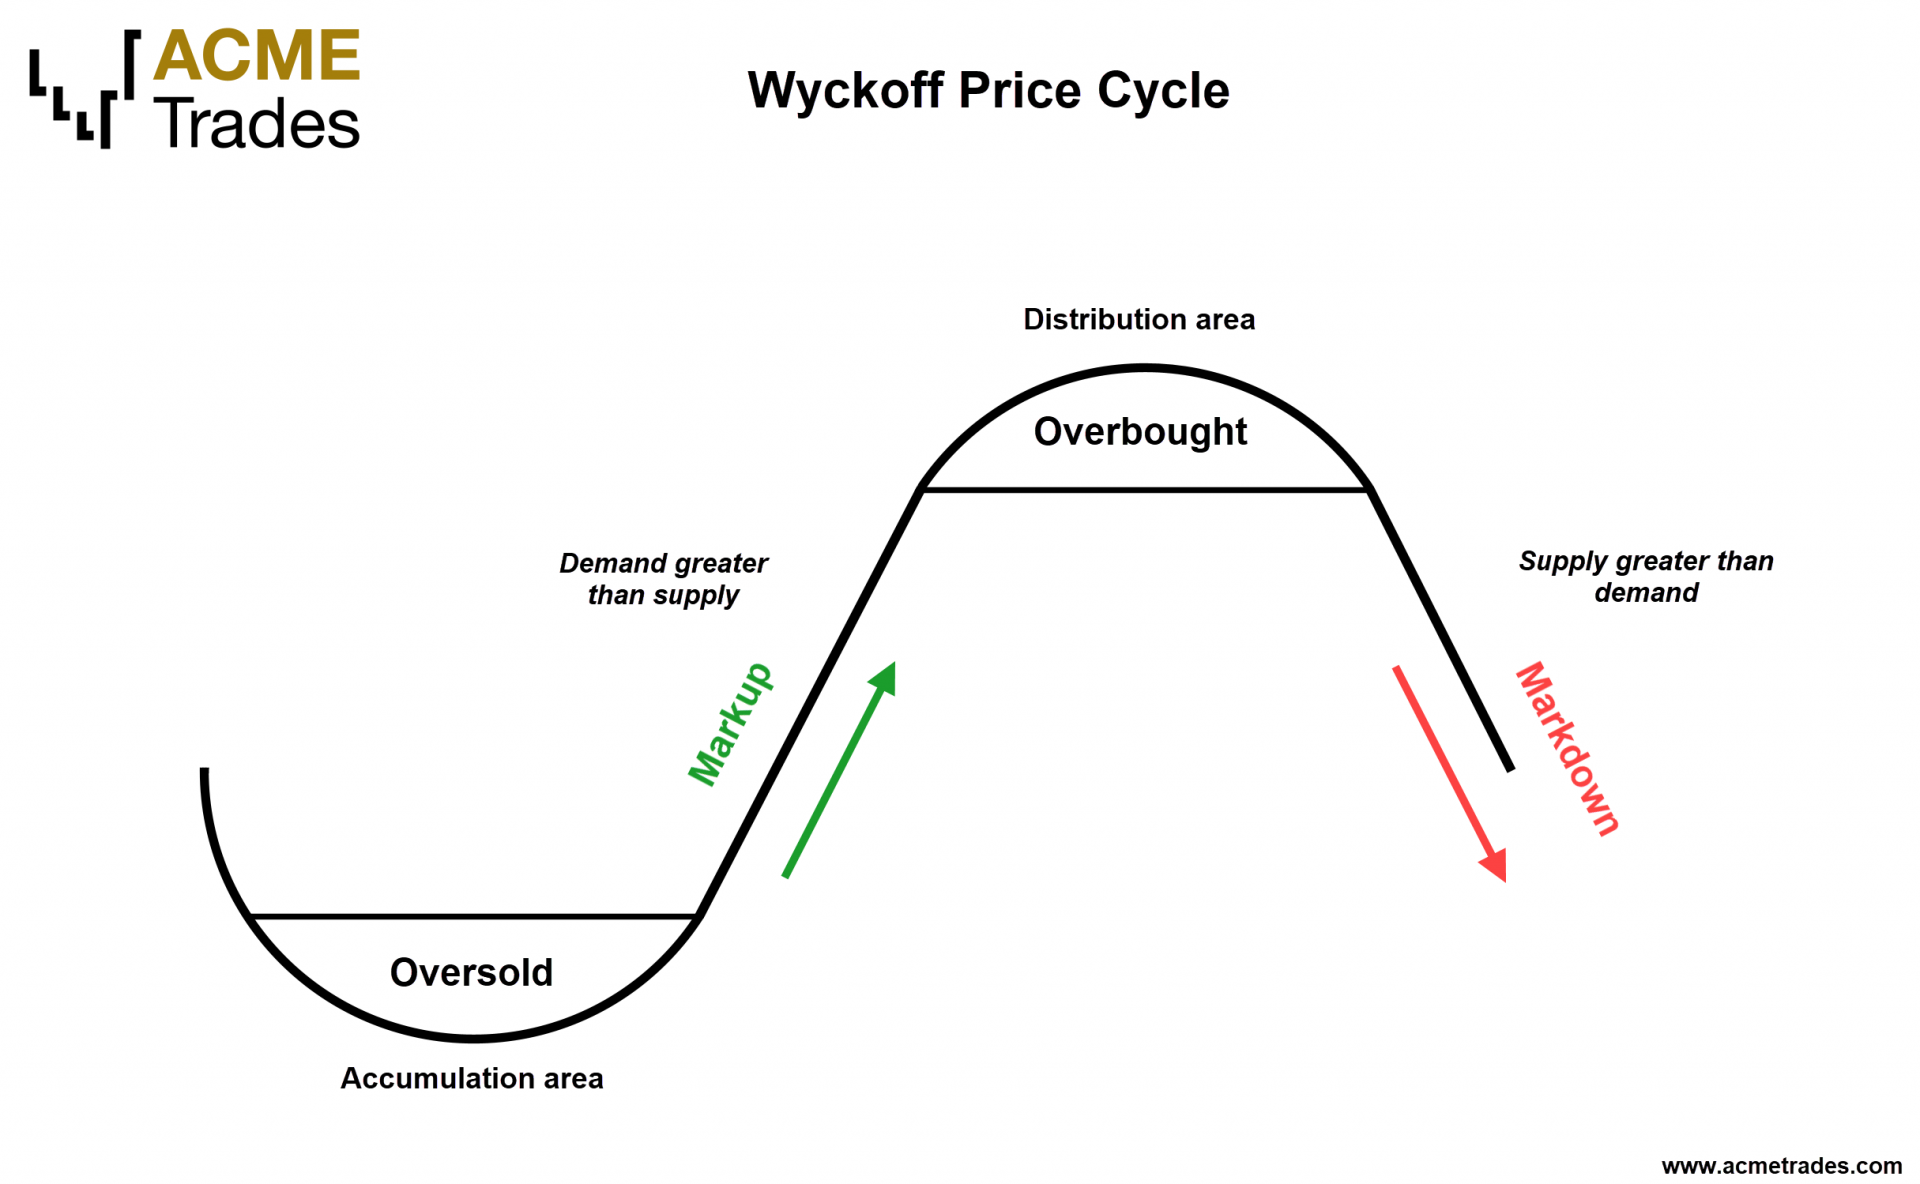
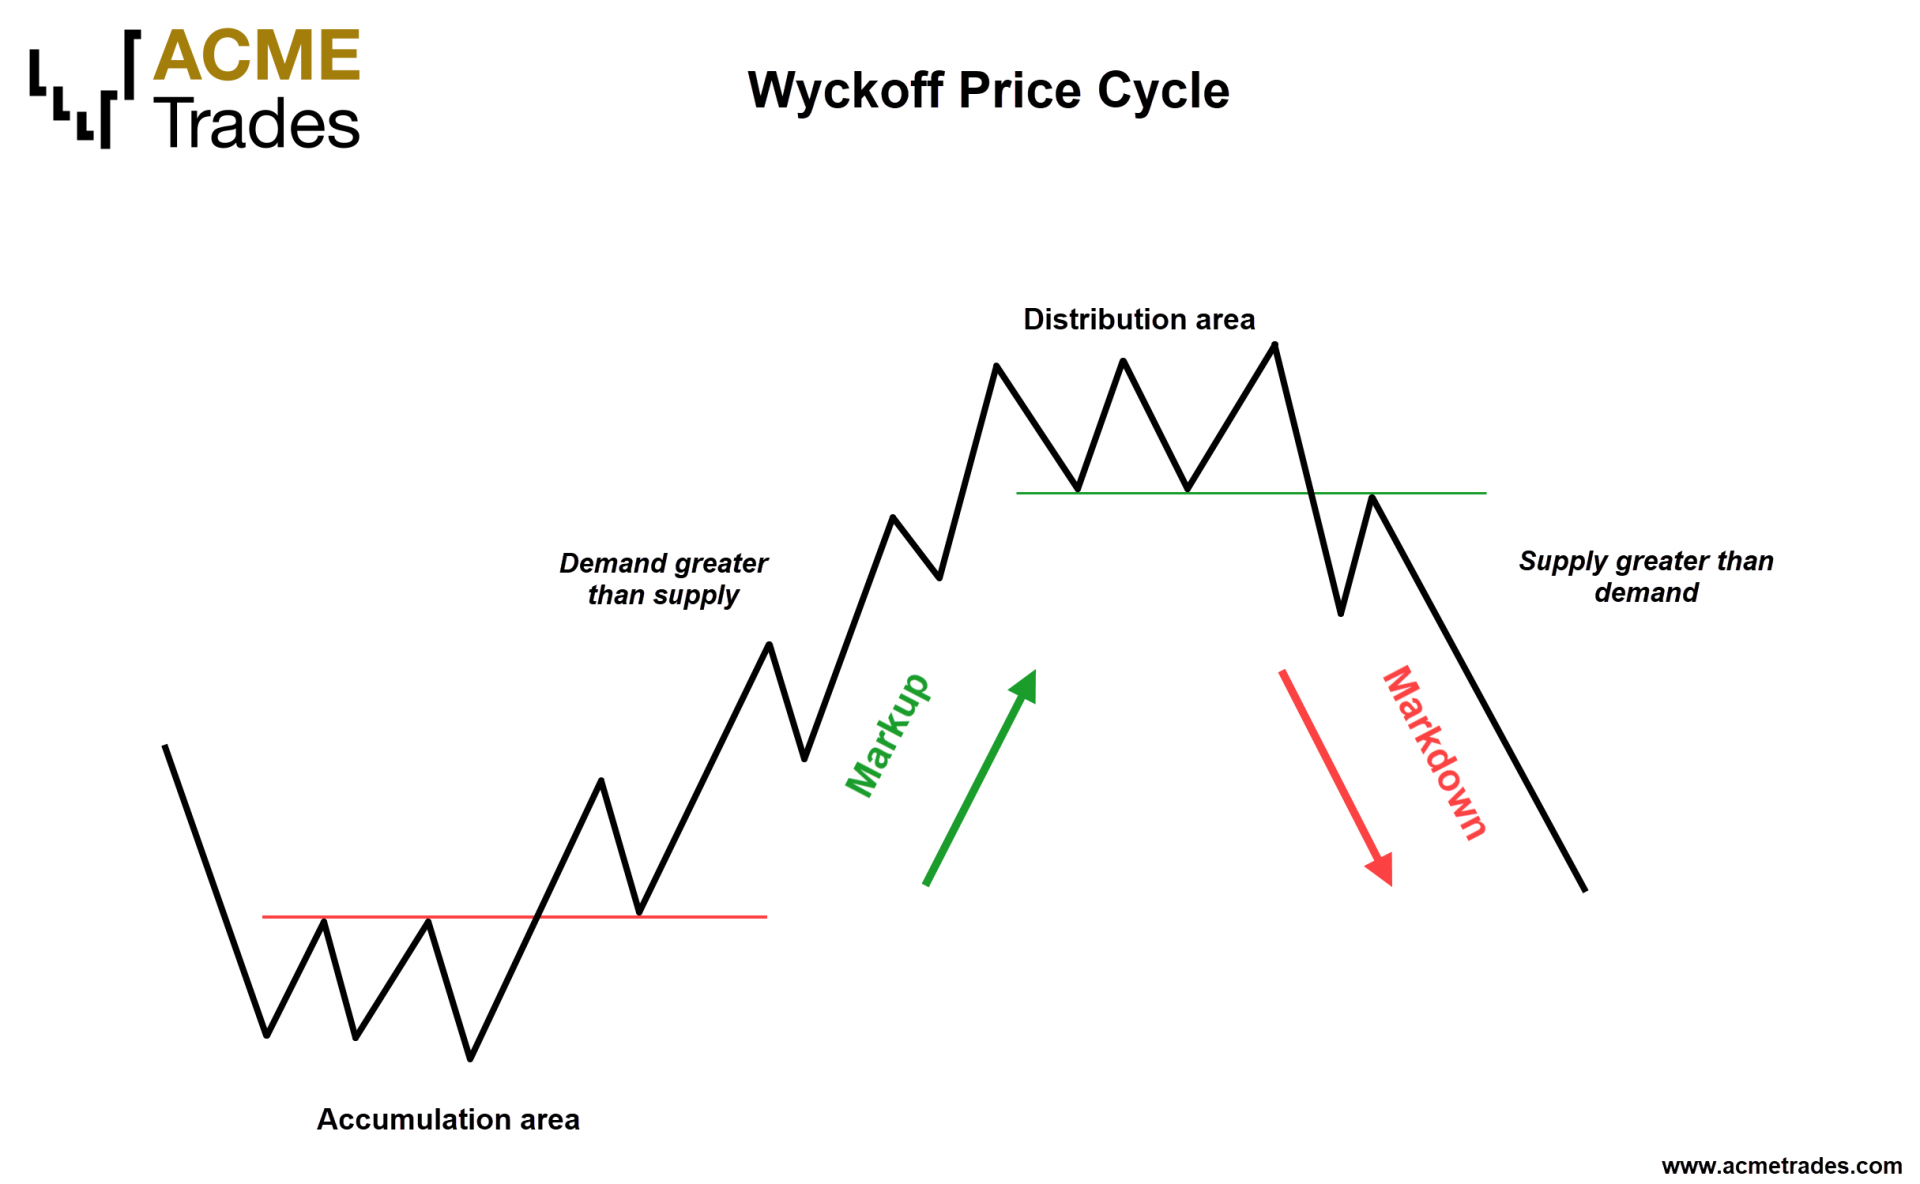
An idealized schematic of how he conceptualized the large interests' preparation for and execution of bull and bear markets is depicted in the figure below.
Wyckoff accumulation
The time to enter long orders is towards the end of the preparation for a price markup or bull market (accumulation of large lines of stock)
Wyckoff distribution
The time to enter short orders is towards the end of the preparation for a price mark down or bear market (distribution of large lines of stock)


The Three Wyckoff Laws
Wyckoff's chart-based methodology rests on three fundamental “laws” that affect many aspects of analysis. These include determining the market's and individual stocks' current and potential future directional bias, selecting the best stocks to trade long or short, identifying the readiness of a stock to leave a trading range and projecting price targets in a trend from a stock’s behavior in a trading range. These laws inform the analysis of every chart and the selection of every stock to trade.
The Law of Supplyand Demand determines the price direction. This principle is central to Wyckoff's method of trading and investing. When demand is greater than supply, prices rise, and when supply is greater than demand, prices fall. The trader/analyst can study the balance between supply and demand by comparing price and volume bars over time. This law is deceptively simple, but learning to accurately evaluate supply and demand on bar charts, as well as understanding the implications of supply and demand patterns, takes considerable practice.
The Law of Cause and Effect helps the trader and investor set price objectives by gauging the potential extent of a trend emerging from a trading range. Wyckoff's “cause” can be measured by the horizontal point count in a Point and Figure chart, while the “effect” is the distance price moves corresponding to the point count. This law's operation can be seen as the force of accumulation or distribution within a trading range, as well as how this force works itself out in a subsequent trend or movement up or down. Point and Figure chart counts are used to measure a cause and project the extent of its effect.
The Law of Effort vs. Result provides an early warning of a possible change in trend in the near future. Divergences between volume and price often signal a change in the direction of a price trend. For example, when there are several high-volume (large effort) but narrow-range price bars after a substantial rally, with the price failing to make a new high (little or no result) this suggests that big interests are unloading shares in anticipation of a change in trend.
All information and photos referenced from wyckoffanalytics.com, https://www.investopedia.com & https://estudosemtapereading.com.br/. Graphics from ACME Trades©
Wyckoff Price Cycle
According to Wyckoff, the market can be understood and anticipated through detailed analysis of supply and demand, which can be ascertained from studying price action, volume and time. As a broker, he was in a position to observe the activities of highly successful individuals and groups who dominated specific issues; consequently, he was able to decipher, via the use of what he called vertical (bar) and figure (Point and Figure) charts, the future intentions of those large interests.
An idealized schematic of how he conceptualized the large interests' preparation for and execution of bull and bear markets is depicted in the figure below.
Wyckoff Accumulation
The time to enter long orders is towards the end of the preparation for a price markup or bull market (accumulation of large lines of stock)
Wyckoff Distribution
The time to enter short orders is towards the end of the preparation for a price mark down or bear market (distribution of large lines of stock)


The Three Wyckoff Laws
Wyckoff's chart-based methodology rests on three fundamental “laws” that affect many aspects of analysis. These include determining the market's and individual stocks' current and potential future directional bias, selecting the best stocks to trade long or short, identifying the readiness of a stock to leave a trading range and projecting price targets in a trend from a stock’s behavior in a trading range. These laws inform the analysis of every chart and the selection of every stock to trade.
The Law of Supplyand Demand determines the price direction. This principle is central to Wyckoff's method of trading and investing. When demand is greater than supply, prices rise, and when supply is greater than demand, prices fall. The trader/analyst can study the balance between supply and demand by comparing price and volume bars over time. This law is deceptively simple, but learning to accurately evaluate supply and demand on bar charts, as well as understanding the implications of supply and demand patterns, takes considerable practice.
The Law of Cause and Effect helps the trader and investor set price objectives by gauging the potential extent of a trend emerging from a trading range. Wyckoff's “cause” can be measured by the horizontal point count in a Point and Figure chart, while the “effect” is the distance price moves corresponding to the point count. This law's operation can be seen as the force of accumulation or distribution within a trading range, as well as how this force works itself out in a subsequent trend or movement up or down. Point and Figure chart counts are used to measure a cause and project the extent of its effect.
The Law of Effort vs. Result provides an early warning of a possible change in trend in the near future. Divergences between volume and price often signal a change in the direction of a price trend. For example, when there are several high-volume (large effort) but narrow-range price bars after a substantial rally, with the price failing to make a new high (little or no result) this suggests that big interests are unloading shares in anticipation of a change in trend.
All information and photos referenced from wyckoffanalytics.com, https://www.investopedia.com & https://estudosemtapereading.com.br/. Graphics from ACME Trades©
Who Is The "Composite Man"
“…all the fluctuations in the market and in all the various stocks should be studied as if they were the result of one man’s operations. Let us call him the Composite Man, who, in theory, sits behind the scenes and manipulates the stocks to your disadvantage if you do not understand the game as he plays it; and to your great profit if you do understand it.”
(The Richard D. Wyckoff Course in Stock Market Science and Technique, section 9, p. 1-2)
Based on his years of observations of the market activities of large operators, Wyckoff taught that:
The Composite Man carefully plans, executes and concludes his campaigns.
The Composite Man attracts the public to buy a stock in which he has already accumulated a sizeable line of shares by making many transactions involving a large number of shares, in effect advertising his stock by creating the appearance of a “broad market.”
One must study individual stock charts with the purpose of judging the behavior of the stock and the motives of those large operators who dominate it.
With study and practice, one can acquire the ability to interpret the motives behind the action that a chart portrays. Wyckoff and his associates believed that if one could understand the market behavior of the Composite Man, one could identify many trading and investment opportunities early enough to profit from them.